

Singapore Residential Rental Market Lookback (2024): Private Home Rents Moderate While HDB Rents Grow
- By
- 5 mins read
- HDB, Private Residential (Non-Landed), Rental
- 27 Mar 2025
Since the end of 2023, signs of a bottoming out begun to emerge in Singapore’s private residential rental market, with rents softening throughout 2024. Though the All-Private Residential property rental index saw a slight recovery of 0.8% quarter-on-quarter (q-o-q) in 3Q 2024, it had inched down 1.9% in the first nine months of the year.
This gradual easing in private home rents stemmed from a higher volume of completions in recent years. Between 2022 to 2023, almost 30,000 new private homes attained their Temporary Occupation Permit (TOP), resulting in downwards pressure on rents as the market adjusted to the influx of new supply.
Chart 1: Rental Index of Private Residential Properties
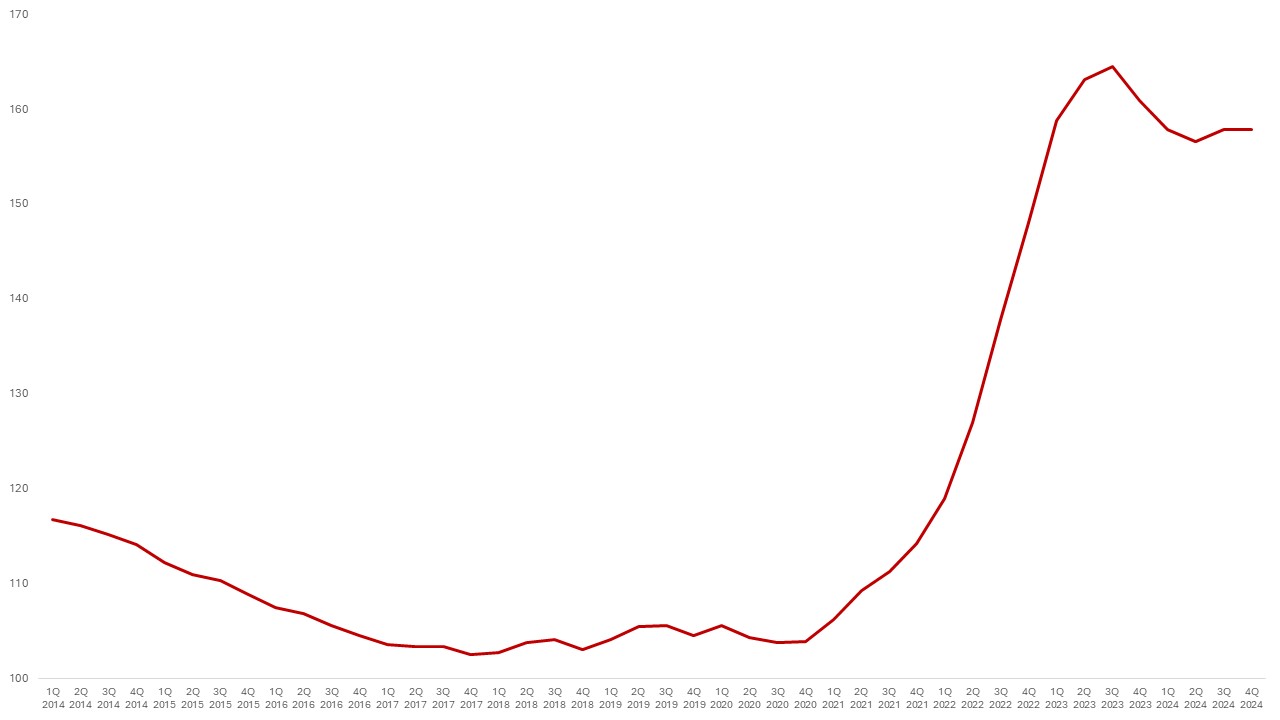
Source: URA, ERA Research and Market Intelligence
Said pressure is apparent when comparing median rents for non-landed private homes up till 3Q 2024. In the first nine months of the year, both the Core Central Region (CCR) and Outside Central Region (OCR) respectively saw downticks of 3.5% and 1.4% since the start of the year. In contrast, rents in the Rest of Central Region rose over the same period, albeit inching up slightly by only 0.4%.
Chart 2: Non-landed median rent by market segment
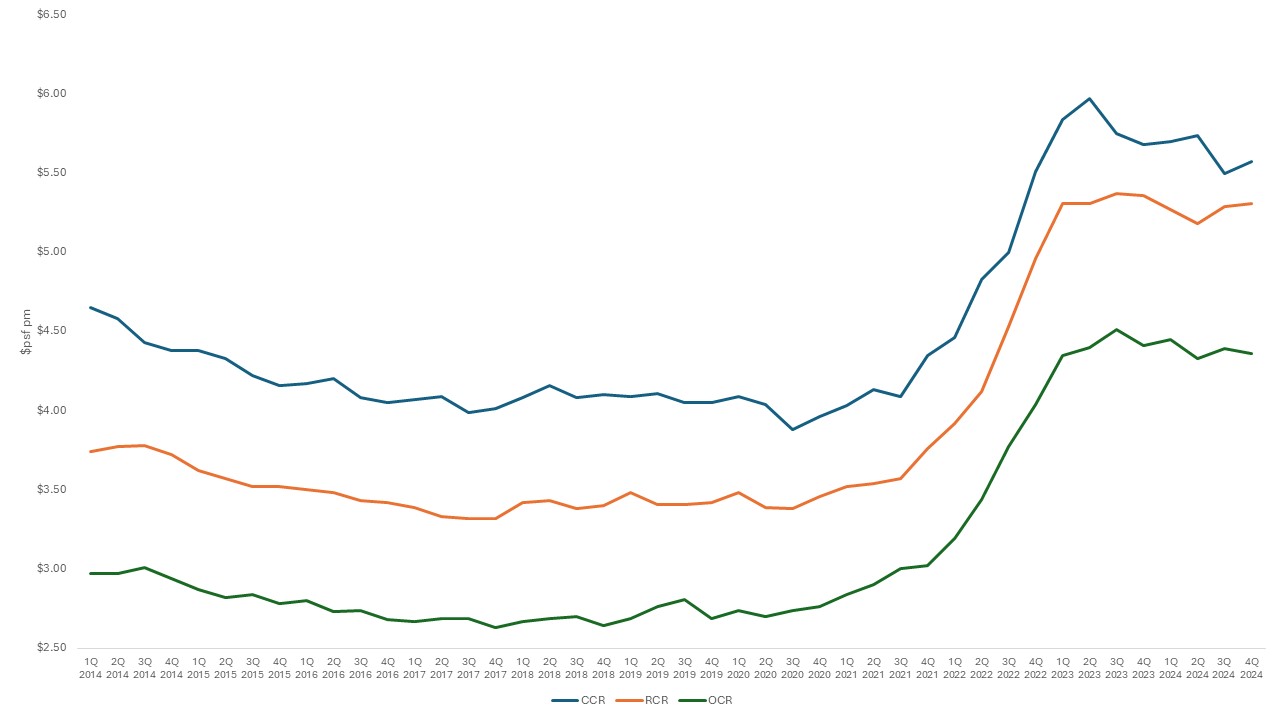
Source: URA, ERA Research and Market Intelligence
For the whole of 2024, a total of 88,523 rental contracts for private homes were inked, representing a 5.2% year-on-year (y-o-y) growth.
Chart 3: Private residential rental contracts
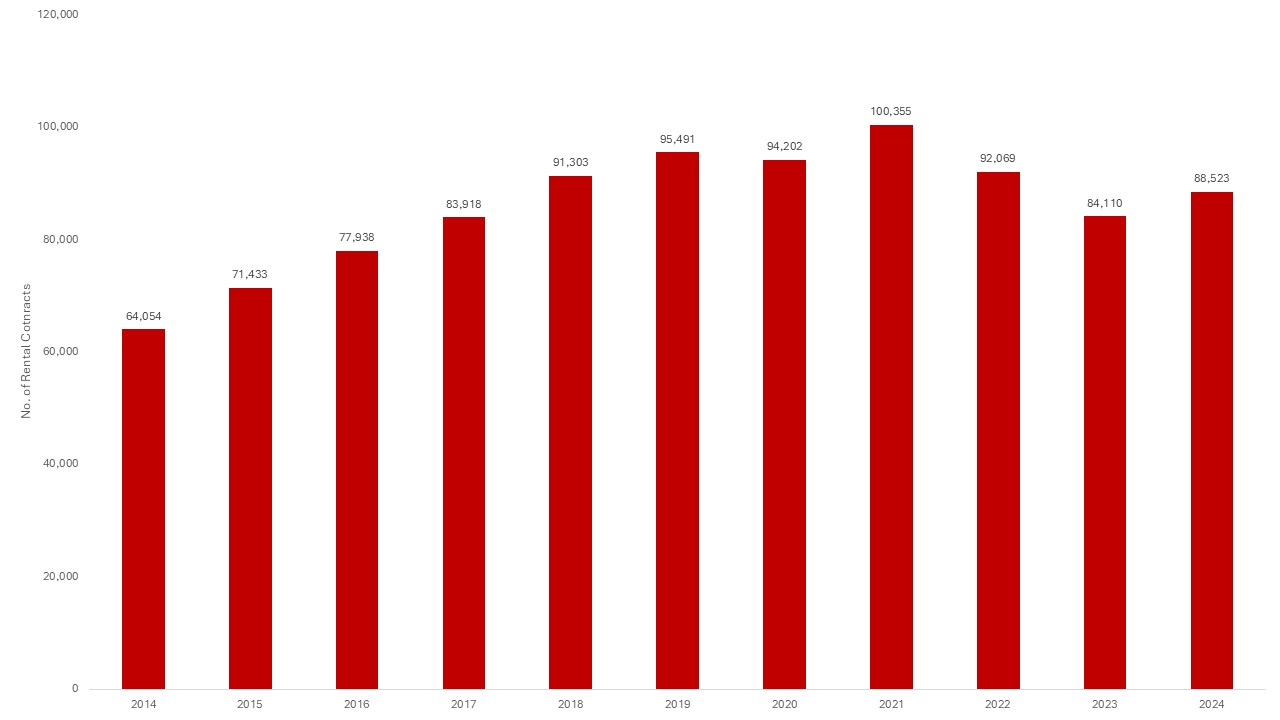
Source: URA, ERA Research and Market Intelligence
Fall in new private home completions next year could boost rental prices
In 2024, a total of 8,460 private homes were completed. However, we can expect 2025 new home completions to decline to some 5,846 units anticipated for 2025, new home completion is set to decline significantly by 30.9% year-on-year.
This notable change in supply is expected to bolster rental prices in the coming months, contributing to a slow but steady pace of growth. Moreover, with landlords of newly-completed homes being inclined to seek higher rents, this could set the stage for rental growth in the private residential market.
Chart 4: Private residential completions

Source: URA, ERA Research and Market Intelligence
Steady foreign hires underpin demand for private home rentals in 2024
Alongside stabilising private home rents, foreign workforce levels held steady in 2024, with Employment Pass (EP) and S-Pass hires closely mirroring last year’s numbers.
As of June 2024, the number of S-Pass holders stood at 176,000, while EP holders numbered 202,400; these statistics are comparable to the full-year figures of 178,000 S-Pass and 205,400 EP holders for 2023. In turn, this stability in foreign hires has helped sustain demand for private home rentals in 2024.
Chart 5: Foreign workforce numbers (EP and S-Pass holders)
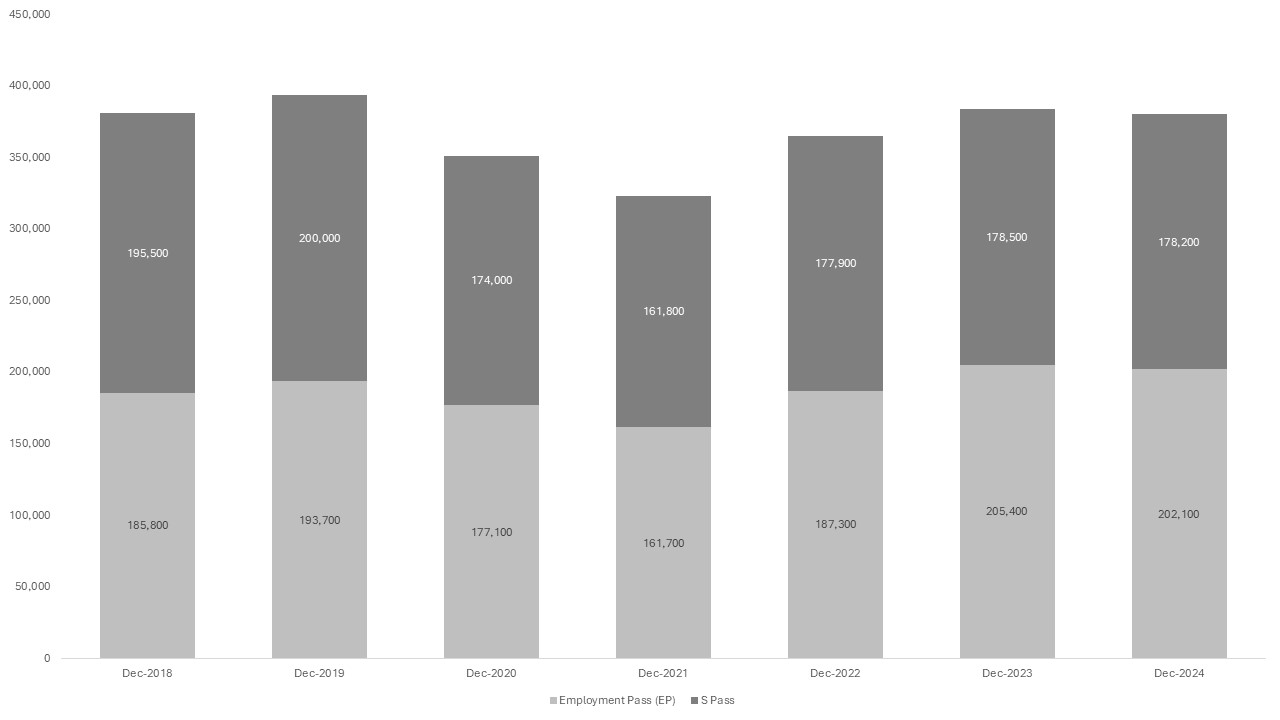
Source: MOM, ERA Research and Market Intelligence
However, faced with potential volatility amid heightened geopolitical and trade tensions, tenants may choose to be more prudent with their rental budgets in 2025. This is despite Singapore’s status as a safe haven distanced away from the epicentre of these events.
Hence, with a more uncertain hiring outlook among multinational companies, the CCR could face duller foreigner demand and a moderation in rental prices next year. Concurrently, private home rents in the OCR and RCR may rise next year with growing demand, as more foreign tenants move towards the outskirts of Singapore to keep their rental expenses in check.
Diverging movements in private home rents across market segments
In 4Q 2024, the vacancy rate for CCR private homes moderated to 1.0%%. This spike was largely due to the completion of prime district projects that added to the supply of rentable units and placed downwards pressure on CCR rents. Examples include One Holland Village Residences (296 units) and The Avenir (376 units), which contributed significantly to the influx of new units in the market and increased competition for tenants among owners of CCR properties.
Table 1: Historical vacancy rate of completed private residential properties by market segment
| Year/Quarter | Vacancy Rate – Islandwide (%) | Vacancy Rate – CCR (%) | Vacancy Rate – RCR (%) | Vacancy Rate – OCR (%) |
| 2020 |
7.0% |
11.0% |
7.3% |
5.1% |
| 2021 |
6.0% |
9.3% |
7.0% |
4.1% |
| 2022 |
5.5% |
6.9% |
7.9% |
3.6% |
| 2023 |
8.1% |
9.8% |
8.1% |
7.4% |
| 1Q 2024 |
6.8% |
8.9% |
6.6% |
6.0% |
| 2Q 2024 |
6.1% |
9.3% |
5.8% |
4.9% |
| 3Q 2024 |
7.2% |
11.2% |
8.1% |
4.9% |
| 4Q 2024 |
6.6% |
10.0% |
7.3% |
4.7% |
Source: URA, ERA Research and Market Intelligence
In contrast, recently completed RCR projects close to the City Core could drive city fringe rents upwards. For instance, RCR developments like One Pearl Bank and The Reef at King’s Dock are well-positioned to support this trend, offering both desirable locational attributes as well as easy access to Singapore’s city core via car and public transport.
Much like the RCR, the OCR could also see rental demand and prices grow as more tenants opt for budget-friendly options in areas outside of the city.
Based on these observations, ERA holds a cautiously optimistic view that overall rental prices for private properties will see a flattish to marginal increase in 2025, within a projected range of 0 to 3% y-o-y as the market adjusts to the influx of new inventory. We also anticipate the number of private home rental contracts to remain consistent, with numbers expected to reach between 80,000 and 90,000 in 2025.
Median HDB rents grew slower across all towns in 2024
In 4Q 2024, median rents for HDB flats grew marginally across the board for all room sizes. On average, median rents for 3-room and 4-room flats inched up slightly by 1.3% and 0.1% y-o-y respectively. Similarly, modest upticks of 0.2% and 5.1% y-o-y were observed for 5-room and executive flats across the various towns over the same period.
Table 2: 4Q 2024 HDB median rents by town and y-o-y growth
| 4Q 2024 | Y-o-y | |||||||||
|
Town |
3-Room |
4-Room |
5-Room |
Executive |
Town |
3-Room |
4-Room |
5-Room |
Executive |
|
|
Ang Mo Kio |
$2,800 |
$3,400 |
$3,650 |
* |
Ang Mo Kio |
0.0% |
3.0% |
-4.0% |
* |
|
|
Bedok |
$2,800 |
$3,200 |
$3,800 |
* |
Bedok |
3.7% |
0.0% |
5.6% |
-100.00% |
|
|
Bishan |
$2,850 |
$3,500 |
$4,000 |
* |
Bishan |
-5.0% |
0.0% |
11.1% |
* |
|
|
Bukit Batok |
$2,700 |
$3,200 |
$3,600 |
* |
Bukit Batok |
0.0% |
0.0% |
1.4% |
* |
|
|
Bukit Merah |
$3,000 |
$3,900 |
$4,100 |
– |
Bukit Merah |
2.3% |
2.6% |
2.5% |
* |
|
|
Bukit Panjang |
$2,600 |
$3,000 |
$3,200 |
* |
Bukit Panjang |
18.1% |
0.0% |
0.0% |
-100.0% |
|
|
Bukit Timah |
* |
* |
* |
* |
Bukit Timah |
* |
* |
* |
* |
|
|
Central |
$3,200 |
$4,300 |
* |
– |
Central |
6.6% |
7.5% |
* |
||
|
Choa Chu Kang |
$2,600 |
$3,000 |
$3,300 |
$3,400 |
Choa Chu Kang |
0.0% |
1.5% |
-2.8% |
||
|
Clementi |
$3,000 |
$3,800 |
$4,200 |
* |
Clementi |
0.0% |
-5.0% |
0.0% |
* |
|
|
Geylang |
$2,800 |
$3,600 |
$3,780 |
* |
Geylang |
3.7% |
1.9% |
-3.0% |
* |
|
|
Hougang |
$2,700 |
$3,200 |
$3,400 |
$3,790 |
Hougang |
3.8% |
0.0% |
-1.5% |
-2.3% |
|
|
Jurong East |
$2,800 |
$3,500 |
$3,700 |
* |
Jurong East |
8.5% |
11.1% |
2.8% |
* |
|
|
Jurong West |
$2,700 |
$3,400 |
$3,600 |
$3,800 |
Jurong West |
3.9% |
3.8% |
2.9% |
11.8% |
|
|
Kallang/ Whampoa |
$2,930 |
$3,800 |
$4,000 |
* |
Kallang/ Whampoa |
4.6% |
5.6% |
6.7% |
* |
|
|
Marine Parade |
$2,900 |
$3,380 |
* |
– |
Marine Parade |
3.6% |
-3.4% |
* |
* |
|
|
Pasir Ris |
* |
$3,200 |
$3,500 |
$3,800 |
Pasir Ris |
0.0% |
0.0% |
0.5% |
||
|
Punggol |
$2,800 |
$3,200 |
$3,250 |
* |
Punggol |
-6.67% |
0.00% |
-4.41% |
* |
|
|
Queenstown |
$3,000 |
$4,100 |
$4,500 |
* |
Queenstown |
0.0% |
1.2% |
4.7% |
* |
|
|
Sembawang |
* |
$3,100 |
$3,200 |
$3,500 |
Sembawang |
3.3% |
0.0% |
0.0% |
||
|
Sengkang |
$2,800 |
$3,200 |
$3,300 |
$3,500 |
Sengkang |
-1.1% |
0.0% |
-3.0% |
-1.4% |
|
|
Serangoon |
$2,700 |
$3,500 |
$3,500 |
* |
Serangoon |
0.0% |
9.4% |
9.4% |
-100.0% |
|
|
Tampines |
$2,800 |
$3,400 |
$3,550 |
$4,000 |
Tampines |
0.0% |
1.5% |
-1.4% |
8.1% |
|
|
Toa Payoh |
$2,800 |
$3,500 |
$4,000 |
* |
Toa Payoh |
0.0% |
0.0% |
5.3% |
* |
|
|
Woodlands |
$2,500 |
$3,000 |
$3,200 |
$3,500 |
Woodlands |
-3.1% |
0.0% |
-3.0% |
-4.1% |
|
|
Yishun |
$2,600 |
$3,100 |
$3,300 |
* |
Yishun |
0.0% |
3.3% |
-5.7% |
-100.0% |
|
|
Average |
$2,799 |
$3,419 |
$3,636 |
$3,661 |
|
Average |
1.3% |
0.1% |
0.2% |
5.1% |
Source: HDB, ERA Research and Market intelligence
(-) Indicates that there are no rental transactions in the quarter
* Indicates that the median rent is not shown because there are less than 20 rental transactions in the quarter for that particular town and flat type
Chart 6: Number of rental approvals for HDBs
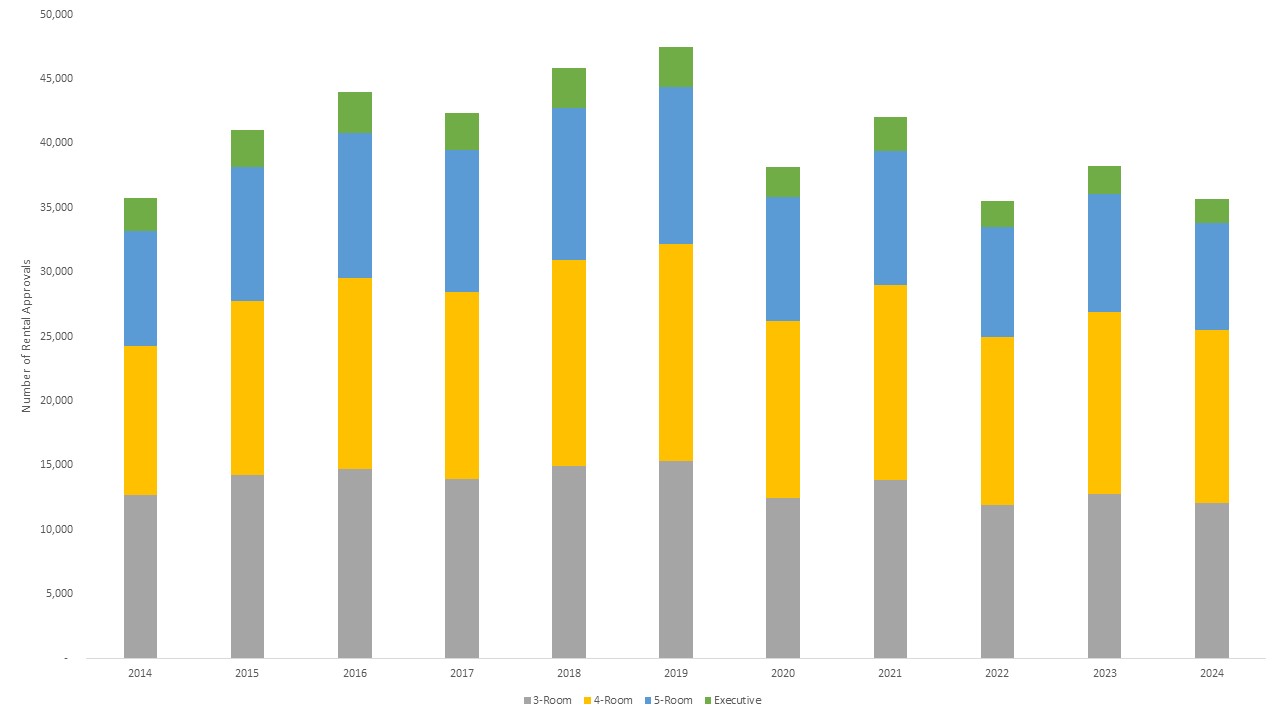
Source: HDB, ERA Research and Market Intelligence
Source: HDB, ERA Research and Market Intelligence
Furthermore, 35,709 HDB flats were rented out in 2024, representing a 6.2% y-o-y decline compared to 2023 (39,138 units leased).
Possible Price Growth with fewer HDB flats completing Minimum Occupation Period in 2025
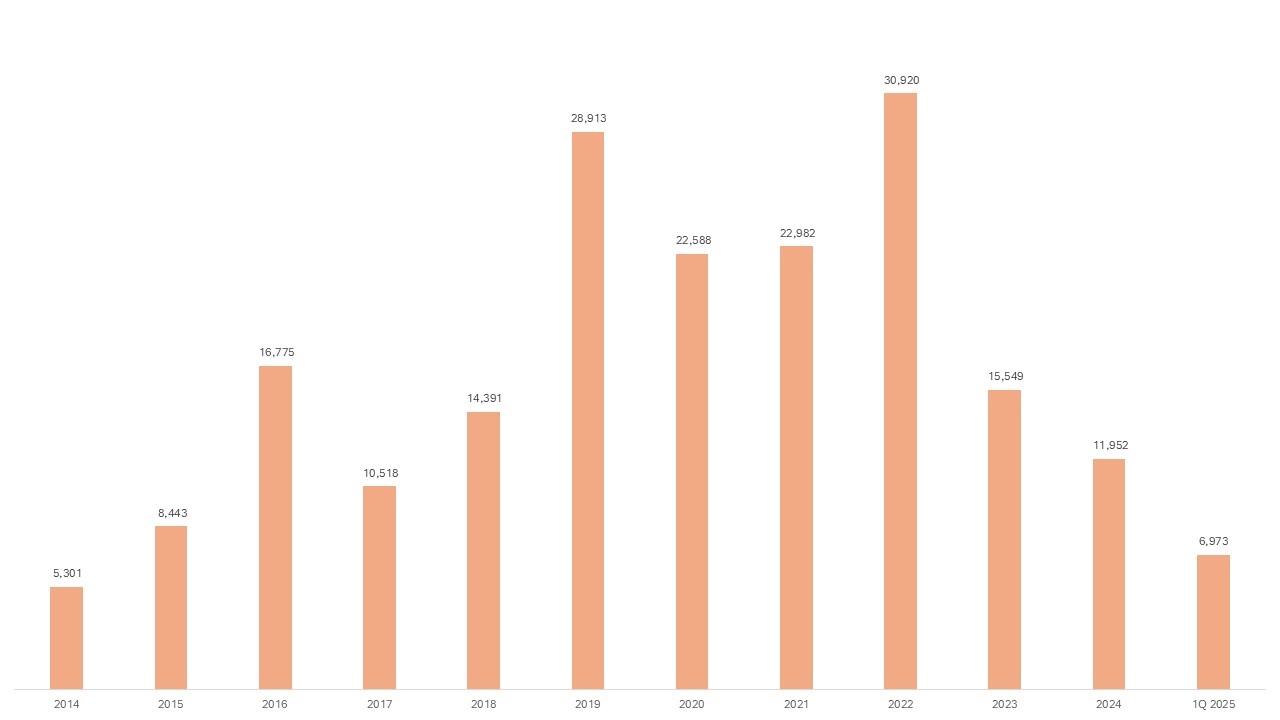
In 2024, an estimated total of 11,952 HDB flats are expected to reach the end of their Minimum Occupation Period (MOP). However, this figure is set to fall significantly next year, with only 6,974 HDB flats projected to achieve MOP completion status by end-2025.
Moreover, 2025 is set to have the fewest MOP flats since 2015, which saw just 8,443 flats attaining MOP. This also marks a continued decline from the peak of 30,920 MOP flats recorded in 2022.
Chart 7: No. of HDB flats achieving MOP status by year
Source: data.gov.sg, ERA Research and Market Intelligence
Consequently, the HDB leasing market is likely to see price uplifts in 2025 as the squeeze on MOP flat numbers continues to tighten next year. Factoring in the possibility of a rise in demand for HDB rentals from price-sensitive tenants amid potential economic uncertainty, ERA predicts that HDB rents could rise 2 to 5% y-o-y next year.
Meanwhile, HDB flat rental volume is expected to range between 34,000 and 36,000 in 2025; this is lower than the full-year estimate of 36,000 to 38,000 for 2024, likewise due to a decrease in the number of MOP flats.
Rental market to favour landlords in 2025 as leasing inventory falls
With the supply of completed units tightening in both the private home and HDB markets, prices in the residential leasing market are primed for growth in 2025. Moreover, assuming no significant changes in economic conditions and foreign worker numbers, rental demand is also likely to stay consistent next year without any significant spikes or declines.
However, rental price growth is likely to diverge across the market, with newly completed homes expected to sustain stronger rent appreciation, while older properties may experience slower or flattish growth. Similarly, properties in Singapore’s outlying regions could see sharper increases in rents and stronger demand as tenants become more cost-conscious.
Come next year, ERA forecasts tempered rental price growth for private homes within a projected range of 0 to 3% y-o-y in the face of fewer completions and a more cautious economic outlook. We also anticipate the number of private home rental contracts to remain consistent, with numbers expected to reach between 80,000 and 90,000 in 2025.
The leasing market for HDB flats is expected to exhibit similar price movements, with rents growing within a ballpark range of 2 to 5% y-o-y. Meanwhile, demand for HDB rentals is predicted to trend lower with rental volume ranging between 34,000 and 36,000 in 2025.
Disclaimer
This information is provided solely on a goodwill basis and does not relieve parties of their responsibility to verify the information from the relevant sources and/or seek appropriate advice from relevant professionals such as valuers, financial advisers, bankers and lawyers. For avoidance of doubt, ERA Realty Network and its salesperson accepts no responsibility for the accuracy, reliability and/or completeness of the information provided. Copyright in this publication is owned by ERA and this publication may not be reproduced or transmitted in any form or by any means, in whole or in part, without prior written approval.